04 — Phase Portrait: The Sheet Music#
The Ott–Antonsen reduction gives a 1D flow on the order parameter \(r \in [0,1]\):
This notebook animates the phase portrait as \(x\) sweeps from Newtonian (\(x \gg 1\)) to deep MOND (\(x \ll 1\)), then maps the result onto a real galaxy (NGC 2403 from SPARC).
Three panels:
Left: Phase portrait \((r, \dot{r})\) with flow arrows and fixed-point trajectory
Center: \(\mu(x) = 1 - e^{-\sqrt{x}}\) with the current \(x\) highlighted
Right: NGC 2403 rotation curve, each radius colored by its local \(x(R)\)
Companion to lyapunov_uniqueness.md and the
walkthrough.
%matplotlib inline
import numpy as np
import matplotlib.pyplot as plt
import matplotlib.colors as mcolors
from matplotlib.animation import FuncAnimation
from matplotlib.collections import LineCollection
from IPython.display import HTML
import math
import os
print('Imports ready.')
Imports ready.
1. The Ott–Antonsen flow#
For a Kuramoto system with Lorentzian frequency spread \(\gamma\) and effective coupling \(K_{\text{eff}} = 2\gamma x\):
Fixed points:
\(r = 0\) always (incoherent)
\(r^* = \sqrt{1 - 1/x}\) for \(x > 1\) (synchronized)
At \(x = 1\): the synchronized fixed point collides with \(r = 0\) — a transcritical bifurcation. This is the MOND boundary.
# OA flow: rdot = gamma * r * [x(1 - r^2) - 1]
gamma = 1.0
def rdot(r, x):
"""Ott-Antonsen flow for order parameter r at supercriticality x."""
return gamma * r * (x * (1 - r**2) - 1)
def r_star(x):
"""Stable fixed point for x > 1."""
return np.sqrt(np.maximum(0, 1 - 1/np.where(x > 0, x, 1e-10)))
def mu_rar(x):
"""MOND interpolation function (RAR form, delta=1/2)."""
return 1 - np.exp(-np.sqrt(np.maximum(0, x)))
# Verify
print(f'r*(x=10) = {r_star(10):.4f} (expect ~0.949)')
print(f'r*(x=2) = {r_star(2):.4f} (expect ~0.707)')
print(f'r*(x=1) = {r_star(1):.4f} (bifurcation point)')
print(f'mu(x=1) = {mu_rar(1):.4f}')
print(f'mu(x=10) = {mu_rar(10):.4f}')
r*(x=10) = 0.9487 (expect ~0.949)
r*(x=2) = 0.7071 (expect ~0.707)
r*(x=1) = 0.0000 (bifurcation point)
mu(x=1) = 0.6321
mu(x=10) = 0.9577
2. Load NGC 2403 from SPARC#
NGC 2403 is a well-studied Sc galaxy at 3.16 Mpc, spanning both Newtonian and MOND regimes.
# Load SPARC data — fetch from GitHub, fall back to local sibling repo
from urllib.request import urlopen
SPARC_URL = 'https://raw.githubusercontent.com/nickjoven/201/main/data/NGC2403_rotmod.dat'
def load_sparc(url=SPARC_URL):
"""Fetch SPARC rotation curve data. Tries URL first, then local paths."""
lines = None
try:
lines = urlopen(url).read().decode('utf-8').splitlines()
print(f'Loaded from {url}')
except Exception:
for local in [
os.path.normpath(os.path.join(os.path.dirname(os.getcwd()), '..', '201', 'data', 'NGC2403_rotmod.dat')),
os.path.expanduser('~/AI/pros/201/data/NGC2403_rotmod.dat'),
]:
if os.path.exists(local):
with open(local) as f:
lines = f.read().splitlines()
print(f'Loaded from {local}')
break
if lines is None:
raise FileNotFoundError('Cannot fetch NGC2403 data from GitHub or local paths.')
return lines
raw_lines = load_sparc()
# Parse: skip comment lines starting with # or !
R_kpc, V_obs, V_err, V_gas, V_disk, V_bul = [], [], [], [], [], []
for line in raw_lines:
line = line.strip()
if not line or line[0] in '#!%':
continue
parts = line.split()
if len(parts) >= 6:
R_kpc.append(float(parts[0]))
V_obs.append(float(parts[1]))
V_err.append(float(parts[2]))
V_gas.append(float(parts[3]))
V_disk.append(float(parts[4]))
V_bul.append(float(parts[5]))
R_kpc = np.array(R_kpc)
V_obs = np.array(V_obs)
V_err = np.array(V_err)
V_gas = np.array(V_gas)
V_disk = np.array(V_disk)
V_bul = np.array(V_bul)
# Baryonic velocity: v_bary^2 = v_gas^2 + v_disk^2 + v_bul^2
V_bary = np.sqrt(V_gas**2 + V_disk**2 + V_bul**2)
# Convert to accelerations (km/s -> m/s, kpc -> m)
kpc_to_m = 3.0857e19
kms_to_ms = 1e3
R_m = R_kpc * kpc_to_m
a_obs = (V_obs * kms_to_ms)**2 / R_m
a_bary = (V_bary * kms_to_ms)**2 / R_m
a0 = 1.2e-10 # m/s^2
x_R = a_bary / a0 # local supercriticality ratio at each radius
print(f'NGC 2403: {len(R_kpc)} radial points, {R_kpc[0]:.1f}–{R_kpc[-1]:.1f} kpc')
print(f'x = a_bary/a0 range: {x_R.min():.3f} to {x_R.max():.1f}')
print(f'MOND transition (x=1) near R ~ {R_kpc[np.argmin(np.abs(x_R - 1))]:.1f} kpc')
Loaded from https://raw.githubusercontent.com/nickjoven/201/main/data/NGC2403_rotmod.dat
NGC 2403: 73 radial points, 0.2–20.9 kpc
x = a_bary/a0 range: 0.048 to 2.0
MOND transition (x=1) near R ~ 2.9 kpc
3. Static three-panel figure#
Before animating, build the key frame: all three panels at a specific \(x\) value.
%matplotlib inline
# Color scheme matching docs/index.html dark theme
BG = '#0d1117'
SURFACE = '#161b22'
BORDER = '#30363d'
TEXT = '#e6edf3'
MUTED = '#8b949e'
BLUE = '#58a6ff'
GREEN = '#7ee787'
PURPLE = '#d2a8ff'
ORANGE = '#ffa657'
RED = '#f85149'
# Diverging colormap: blue (locked/Newtonian) -> red (drifting/MOND)
cmap_sync = mcolors.LinearSegmentedColormap.from_list(
'sync', [(0, RED), (0.3, ORANGE), (0.5, '#ffffff'), (0.7, BLUE), (1.0, PURPLE)])
def make_figure(x_current=3.0, save_path=None):
"""Three-panel phase portrait at a given x."""
fig, axes = plt.subplots(1, 3, figsize=(16, 5),
gridspec_kw={'width_ratios': [1, 0.8, 1.2]})
fig.patch.set_facecolor(BG)
for ax in axes:
ax.set_facecolor(SURFACE)
ax.tick_params(colors=TEXT, labelsize=9)
for spine in ax.spines.values():
spine.set_color(BORDER)
# === Panel 1: Phase portrait (r, rdot) ===
ax1 = axes[0]
r_arr = np.linspace(0.001, 0.999, 200)
# Background: ghost curves for several x values
for x_bg in [0.3, 0.5, 1.0, 2.0, 5.0, 10.0]:
rd = rdot(r_arr, x_bg)
ax1.plot(r_arr, rd, color=MUTED, alpha=0.15, linewidth=0.8)
# Current x curve
rd_current = rdot(r_arr, x_current)
ax1.plot(r_arr, rd_current, color=BLUE, linewidth=2.2, zorder=5)
# Nullcline
ax1.axhline(0, color=MUTED, linewidth=0.5, linestyle='--')
# Fixed points
ax1.plot(0, 0, 'o', color=RED if x_current > 1 else GREEN,
markersize=8, zorder=10) # r=0: unstable if x>1, stable if x<1
if x_current > 1:
rs = r_star(x_current)
ax1.plot(rs, 0, 'o', color=GREEN, markersize=10, zorder=10)
ax1.annotate(f'$r^* = {rs:.3f}$', (rs, 0),
textcoords='offset points', xytext=(8, 12),
color=GREEN, fontsize=10, fontweight='bold')
# Flow arrows
r_arrows = np.linspace(0.05, 0.95, 12)
for ra in r_arrows:
rd_a = rdot(ra, x_current)
if abs(rd_a) > 0.005:
ax1.annotate('', xy=(ra + 0.02 * np.sign(rd_a), rd_a),
xytext=(ra, rd_a),
arrowprops=dict(arrowstyle='->', color=ORANGE, lw=1.5))
# Fixed-point trajectory curve (trace r* as x varies)
x_trace = np.linspace(1.01, 12, 100)
r_trace = r_star(x_trace)
ax1.plot(r_trace, np.zeros_like(r_trace), '-', color=PURPLE,
linewidth=1.5, alpha=0.5, zorder=3)
ax1.set_xlabel('$r$ (coherence)', color=TEXT, fontsize=11)
ax1.set_ylabel('$\\dot{r}$', color=TEXT, fontsize=11)
ax1.set_xlim(-0.02, 1.02)
ym = max(0.3, abs(rd_current).max() * 1.3)
ax1.set_ylim(-ym, ym)
regime = 'Newtonian' if x_current > 2 else ('boundary' if x_current > 0.8 else 'deep MOND')
ax1.set_title(f'Phase portrait — $x = {x_current:.2f}$ ({regime})',
color=TEXT, fontsize=12, pad=10)
# === Panel 2: mu(x) interpolation curve ===
ax2 = axes[1]
x_mu = np.linspace(0.01, 15, 300)
ax2.plot(x_mu, mu_rar(x_mu), color=BLUE, linewidth=2)
ax2.axvline(1, color=MUTED, linewidth=0.8, linestyle=':')
ax2.axhline(1, color=MUTED, linewidth=0.5, linestyle=':')
# Current x marker
mu_now = mu_rar(x_current)
ax2.plot(x_current, mu_now, 'o', color=ORANGE, markersize=12, zorder=10)
ax2.annotate(f'$\\mu = {mu_now:.3f}$', (x_current, mu_now),
textcoords='offset points', xytext=(10, -15),
color=ORANGE, fontsize=10, fontweight='bold')
# Deep MOND asymptote: mu ~ sqrt(x)
x_deep = np.linspace(0.01, 1, 50)
ax2.plot(x_deep, np.sqrt(x_deep), '--', color=PURPLE, alpha=0.5, linewidth=1)
ax2.text(0.3, 0.7, '$\\sqrt{x}$', color=PURPLE, fontsize=9, alpha=0.7)
ax2.set_xlabel('$x = a/a_0$', color=TEXT, fontsize=11)
ax2.set_ylabel('$\\mu(x)$', color=TEXT, fontsize=11)
ax2.set_xlim(0, 12)
ax2.set_ylim(-0.02, 1.12)
ax2.set_title('$\\mu(x) = 1 - e^{-\\sqrt{x}}$', color=TEXT, fontsize=12, pad=10)
ax2.text(1.1, -0.08, '$a_0$', color=MUTED, fontsize=9)
# === Panel 3: NGC 2403 rotation curve as "score" ===
ax3 = axes[2]
# Color each segment by x(R)
# Normalize x to [0, 1] for colormap: use log scale, x in [0.01, 100]
x_norm = np.clip(np.log10(x_R) / 2 * 0.5 + 0.5, 0, 1) # log10(x)/2 centered at x=1
# Build line segments colored by x
points = np.column_stack([R_kpc, V_obs]).reshape(-1, 1, 2)
segments = np.concatenate([points[:-1], points[1:]], axis=1)
lc = LineCollection(segments, cmap=cmap_sync, linewidths=3)
lc.set_array(x_norm[:-1])
ax3.add_collection(lc)
# Error bars
ax3.errorbar(R_kpc, V_obs, yerr=V_err, fmt='none', ecolor=MUTED,
elinewidth=0.8, capsize=0, alpha=0.4)
# Baryonic curve
ax3.plot(R_kpc, V_bary, '--', color=MUTED, linewidth=1.2, label='$V_{\\rm bary}$')
# MOND transition line
R_mond = R_kpc[np.argmin(np.abs(x_R - 1))]
ax3.axvline(R_mond, color=ORANGE, linewidth=1, linestyle=':', alpha=0.7)
ax3.text(R_mond + 0.3, 20, f'$a = a_0$\n$R = {R_mond:.1f}$ kpc',
color=ORANGE, fontsize=8)
# Highlight current x position if it maps to a radius
idx_match = np.argmin(np.abs(x_R - x_current))
ax3.plot(R_kpc[idx_match], V_obs[idx_match], 's', color=ORANGE,
markersize=10, zorder=10, markeredgecolor='white', markeredgewidth=1.5)
ax3.set_xlabel('$R$ (kpc)', color=TEXT, fontsize=11)
ax3.set_ylabel('$V$ (km/s)', color=TEXT, fontsize=11)
ax3.set_xlim(0, R_kpc.max() * 1.05)
ax3.set_ylim(0, V_obs.max() * 1.2)
ax3.set_title('NGC 2403 — rotation curve as score', color=TEXT, fontsize=12, pad=10)
ax3.legend(loc='lower right', fontsize=9, facecolor=SURFACE,
edgecolor=BORDER, labelcolor=TEXT)
# Color bar
sm = plt.cm.ScalarMappable(cmap=cmap_sync, norm=plt.Normalize(0, 1))
cbar = fig.colorbar(sm, ax=ax3, shrink=0.8, pad=0.02, aspect=25)
cbar.set_ticks([0, 0.25, 0.5, 0.75, 1.0])
cbar.set_ticklabels(['0.01', '0.1', '1', '10', '100'])
cbar.set_label('$x = a/a_0$', color=TEXT, fontsize=10)
cbar.ax.tick_params(colors=TEXT, labelsize=8)
fig.tight_layout()
if save_path:
fig.savefig(save_path, dpi=150, facecolor=BG, bbox_inches='tight')
print(f'Saved: {save_path}')
return fig
# Key frames
fig1 = make_figure(x_current=5.0)
plt.show()
print('Newtonian regime: tight fixed point at r* ≈ 0.90, full locking.')
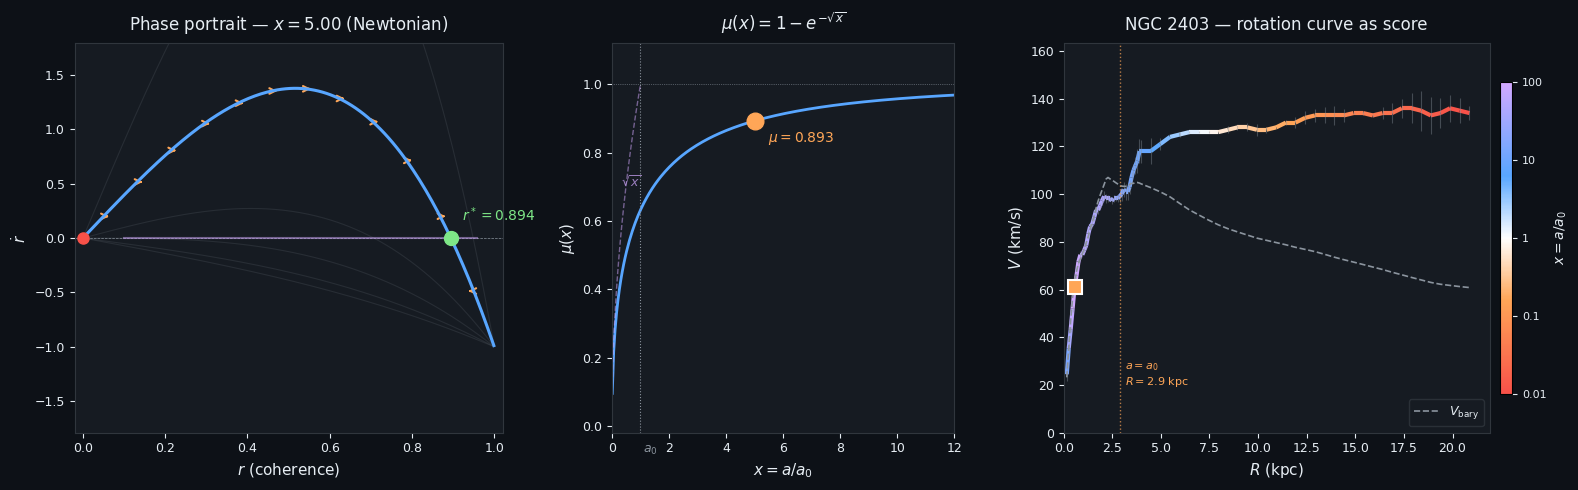
Newtonian regime: tight fixed point at r* ≈ 0.90, full locking.
fig2 = make_figure(x_current=1.0)
plt.show()
print('MOND boundary: bifurcation. r* collides with 0. The spiral opens.')
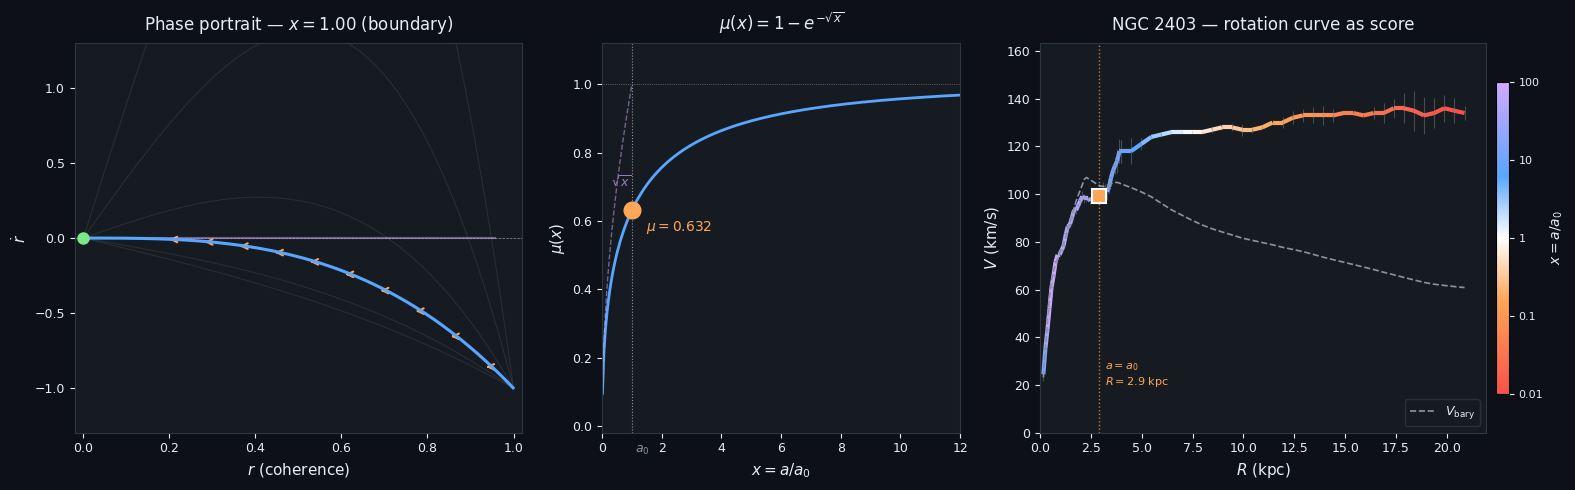
MOND boundary: bifurcation. r* collides with 0. The spiral opens.
fig3 = make_figure(x_current=0.2)
plt.show()
print('Deep MOND: no stable fixed point above 0. Coherence drifts. The "stick" regime.')
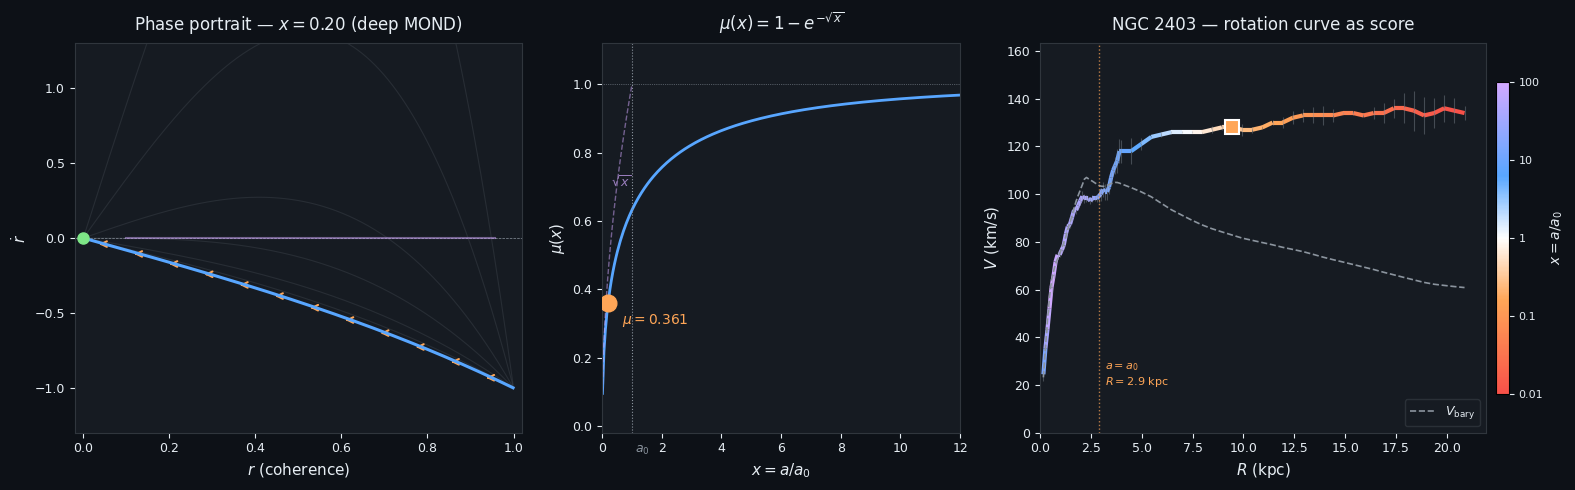
Deep MOND: no stable fixed point above 0. Coherence drifts. The "stick" regime.
4. Animated sweep: Newtonian → MOND#
Sweep \(x\) from 10 down to 0.05 — the journey a star experiences as it orbits from the dense core to the diffuse outskirts.
import matplotlib
matplotlib.use('Agg') # non-interactive backend needed for animation rendering
# Build the animation
n_frames = 120
x_sweep = np.logspace(np.log10(10), np.log10(0.05), n_frames)
fig, axes = plt.subplots(1, 3, figsize=(16, 5),
gridspec_kw={'width_ratios': [1, 0.8, 1.2]})
fig.patch.set_facecolor(BG)
for ax in axes:
ax.set_facecolor(SURFACE)
ax.tick_params(colors=TEXT, labelsize=9)
for spine in ax.spines.values():
spine.set_color(BORDER)
r_arr = np.linspace(0.001, 0.999, 200)
# Panel 1 setup
ax1 = axes[0]
for x_bg in [0.3, 0.5, 1.0, 2.0, 5.0, 10.0]:
ax1.plot(r_arr, rdot(r_arr, x_bg), color=MUTED, alpha=0.12, linewidth=0.8)
ax1.axhline(0, color=MUTED, linewidth=0.5, linestyle='--')
# Fixed-point trajectory
x_trace = np.linspace(1.01, 12, 100)
ax1.plot(r_star(x_trace), np.zeros_like(x_trace), '-', color=PURPLE,
linewidth=1.5, alpha=0.4)
ax1.set_xlabel('$r$ (coherence)', color=TEXT, fontsize=11)
ax1.set_ylabel('$\\dot{r}$', color=TEXT, fontsize=11)
ax1.set_xlim(-0.02, 1.02)
ax1.set_ylim(-1.5, 1.5)
line1, = ax1.plot([], [], color=BLUE, linewidth=2.2)
fp_unstable, = ax1.plot([], [], 'o', color=RED, markersize=8)
fp_stable, = ax1.plot([], [], 'o', color=GREEN, markersize=10)
title1 = ax1.set_title('', color=TEXT, fontsize=12, pad=10)
ann1 = ax1.annotate('', xy=(0, 0), color=GREEN, fontsize=10, fontweight='bold')
# Panel 2 setup
ax2 = axes[1]
x_mu = np.linspace(0.01, 12, 300)
ax2.plot(x_mu, mu_rar(x_mu), color=BLUE, linewidth=2)
ax2.axvline(1, color=MUTED, linewidth=0.8, linestyle=':')
ax2.axhline(1, color=MUTED, linewidth=0.5, linestyle=':')
x_deep = np.linspace(0.01, 1, 50)
ax2.plot(x_deep, np.sqrt(x_deep), '--', color=PURPLE, alpha=0.5, linewidth=1)
ax2.set_xlabel('$x = a/a_0$', color=TEXT, fontsize=11)
ax2.set_ylabel('$\\mu(x)$', color=TEXT, fontsize=11)
ax2.set_xlim(0, 12)
ax2.set_ylim(-0.02, 1.12)
ax2.set_title('$\\mu(x) = 1 - e^{-\\sqrt{x}}$', color=TEXT, fontsize=12, pad=10)
marker2, = ax2.plot([], [], 'o', color=ORANGE, markersize=12)
ann2 = ax2.annotate('', xy=(0, 0), color=ORANGE, fontsize=10, fontweight='bold')
# Panel 3 setup
ax3 = axes[2]
x_norm = np.clip(np.log10(np.maximum(x_R, 1e-3)) / 2 * 0.5 + 0.5, 0, 1)
points = np.column_stack([R_kpc, V_obs]).reshape(-1, 1, 2)
segments = np.concatenate([points[:-1], points[1:]], axis=1)
lc = LineCollection(segments, cmap=cmap_sync, linewidths=3)
lc.set_array(x_norm[:-1])
ax3.add_collection(lc)
ax3.errorbar(R_kpc, V_obs, yerr=V_err, fmt='none', ecolor=MUTED,
elinewidth=0.8, capsize=0, alpha=0.3)
ax3.plot(R_kpc, V_bary, '--', color=MUTED, linewidth=1.2, label='$V_{\\rm bary}$')
R_mond = R_kpc[np.argmin(np.abs(x_R - 1))]
ax3.axvline(R_mond, color=ORANGE, linewidth=1, linestyle=':', alpha=0.6)
ax3.set_xlabel('$R$ (kpc)', color=TEXT, fontsize=11)
ax3.set_ylabel('$V$ (km/s)', color=TEXT, fontsize=11)
ax3.set_xlim(0, R_kpc.max() * 1.05)
ax3.set_ylim(0, V_obs.max() * 1.2)
ax3.set_title('NGC 2403 — rotation curve as score', color=TEXT, fontsize=12, pad=10)
ax3.legend(loc='lower right', fontsize=9, facecolor=SURFACE,
edgecolor=BORDER, labelcolor=TEXT)
galaxy_marker, = ax3.plot([], [], 's', color=ORANGE, markersize=10,
markeredgecolor='white', markeredgewidth=1.5)
fig.tight_layout()
def update(frame):
x_now = x_sweep[frame]
# Panel 1: update flow curve
rd = rdot(r_arr, x_now)
line1.set_data(r_arr, rd)
# Fixed points
if x_now > 1:
fp_unstable.set_data([0], [0])
fp_unstable.set_color(RED)
rs = r_star(x_now)
fp_stable.set_data([rs], [0])
ann1.set_text(f'$r^* = {rs:.3f}$')
ann1.set_position((rs + 0.03, 0.08))
ann1.xy = (rs, 0)
else:
fp_unstable.set_data([0], [0])
fp_unstable.set_color(GREEN) # now stable
fp_stable.set_data([], [])
ann1.set_text('$r^* = 0$')
ann1.set_position((0.05, 0.08))
ann1.xy = (0, 0)
regime = 'Newtonian' if x_now > 2 else ('boundary' if x_now > 0.8 else 'deep MOND')
title1.set_text(f'Phase portrait — $x = {x_now:.2f}$ ({regime})')
# Panel 2: update marker
mu_now = mu_rar(x_now)
marker2.set_data([x_now], [mu_now])
ann2.set_text(f'$\\mu = {mu_now:.3f}$')
ann2.set_position((min(x_now + 0.5, 9), max(mu_now - 0.12, 0.05)))
ann2.xy = (x_now, mu_now)
# Panel 3: highlight matching radius
idx = np.argmin(np.abs(x_R - x_now))
galaxy_marker.set_data([R_kpc[idx]], [V_obs[idx]])
return line1, fp_unstable, fp_stable, ann1, title1, marker2, ann2, galaxy_marker
anim = FuncAnimation(fig, update, frames=n_frames, interval=80, blit=False)
print(f'Animation: {n_frames} frames, x sweeps from {x_sweep[0]:.1f} to {x_sweep[-1]:.2f}')
print('Rendering...')
Animation: 120 frames, x sweeps from 10.0 to 0.05
Rendering...
# Save animation as HTML5 video for inline display
html_anim = anim.to_jshtml(fps=12)
HTML(html_anim)